The sprint tracking is usually done using Burn-Down Chart. Burn-Down Chart shows the remaining effort in day-wise number of hours. For example, let us consider a 2-week sprint -
Sprint Duration: 2 Weeks
No. of Days per Week: 5
No. of Hrs. per Day: 6
No. of Resources: 6
Hence, total remaining effort at the beginning of sprint is 2*5*6*6 = 360 hrs.
Therefore, in an ideal scenario, 36 hours of work gets reduced in the remaining work and the burn-down chart looks as follows -
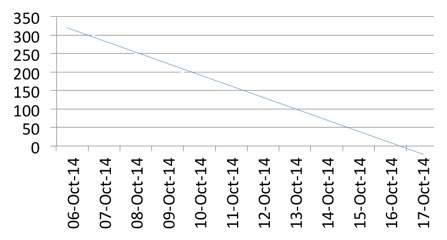
If the sprint work is done as planned daily, the scrum progress is almost aligned to the ideal bar.
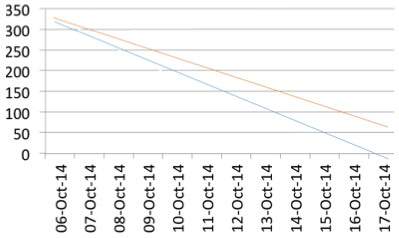
If the sprint work gets delayed and time commitment is not met, the burn-down chart looks as follows -
But, as the burn-down chart is drawn daily, and the slippage is known early, corrective actions can be taken to meet the sprint time line. Suppose, the team stretches to meet the timeline, the burn-down chart looks as follows -
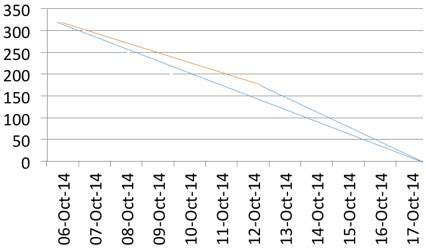
Thus, at any point in time in a Sprint, the total work remaining in the Sprint can be visualized and possibility of meeting sprint timeline can be improved.
Conclusion
Burn-down charts aid the Scrum team to keep track of their progress and what needs to be done to meet the sprint goal.


Comments
Post a Comment